The Program RNAplot
Introduction
You can manually add additional annotation to structure drawings using the RNAplot
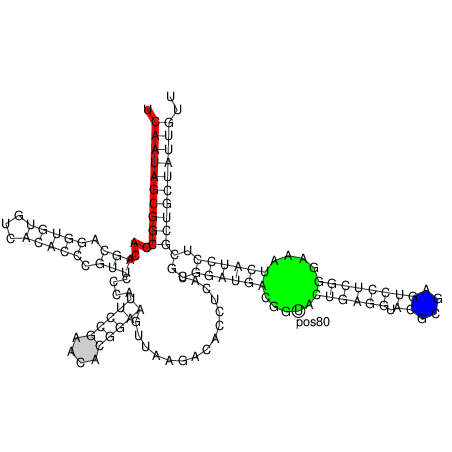
program (for information see its man page). Here’s a somewhat complicated example:
$ RNAfold 5S.seq > 5S.fold
$ RNAplot --pre "76 107 82 102 GREEN BFmark 44 49 0.8 0.8 0.8 Fomark \
  1 15 8 RED omark 80 cmark 80 -0.23 -1.2 (pos80) Label 90 95 BLUE Fomark" < 5S.fold
$ gv 5S_ss.ps

PostScript macros
RNAplot is a very useful tool to color structure layout plots. The --pre tag adds
PostScript code required to color distinct regions of your molecule. There are some predefined
statements with different options for annotations listed below:
Command |
Description |
|---|---|
|
draws circle around base i |
|
draw basepair i,j with c counter examples in grey |
|
stroke segment i…j with linewidth lw and color (rgb) |
|
fill segment i…j with color (rgb) |
|
fill block between pairs i,j and k,l with color (rgb) |
|
adds a textlabel with an offset dx and dy relative to base i |
Predefined color options are BLACK, RED, GREEN, BLUE, WHITE but you can also
replace the value to some standard RGB code (e.g. 0 5 8 for lightblue).
To simply add the annotation macros to the PostScript file without
any actual annotation you can use the following program call
$ RNAplot --pre "" < 5S.fold
If you now open the structure layout file 5S_ss.ps with a text editor you’ll see
the additional macros for cmark, omark, etc. along with some show synopsis
on how to use them. Actual annotations can then be added between the lines:
% Start Annotations
and:
% End Annotations
Here, you simply need to add the same string of commands you would provide through the
--pre option of RNAplot.