genomecov
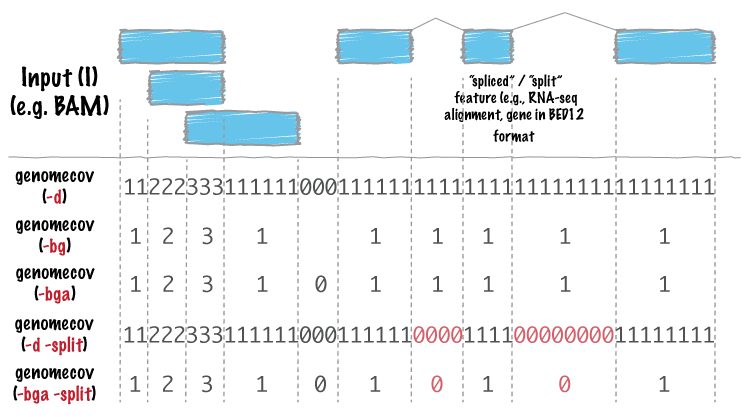
bedtools genomecov computes histograms (default), per-base reports (-d)
and BEDGRAPH (-bg) summaries of feature coverage (e.g., aligned sequences)
for a given genome.
Note
1. If using BED/GFF/VCF, the input (-i) file must be grouped by
chromosome. A simple sort -k 1,1 in.bed > in.sorted.bed will suffice.
Also, if using BED/GFF/VCF, one must provide a genome file via the -g
argument.
2. If the input is in BAM (-ibam) format, the BAM file must be sorted
by position. Using samtools sort aln.bam aln.sorted will suffice.
Usage and option summary
Usage:
bedtools genomecov [OPTIONS] [-i|-ibam] -g (iff. -i)
(or):
genomeCoverageBed [OPTIONS] [-i|-ibam] -g (iff. -i)
Option |
Description |
|---|---|
-ibam |
BAM file as input for coverage. Each BAM alignment in A added to the total coverage for the genome.
Use "stdin" or simply "-" if passing it with a UNIX pipe: For example:
samtools view -b <BAM> | genomeCoverageBed -ibam stdin -g hg18.genome |
-d |
Report the depth at each genome position with 1-based coordinates. |
-dz |
Report the depth at each genome position with 0-based coordinates. Unlike, -d, this reports only non-zero positions. |
-bg |
Report depth in BedGraph format. For details, see: http://genome.ucsc.edu/goldenPath/help/bedgraph.html |
-bga |
Report depth in BedGraph format, as above (i.e., -bg). However with this option, regions with zero coverage are also reported. This allows one to quickly extract all regions of a genome with 0 coverage by applying: "grep -w 0$" to the output. |
-split |
Treat "split" BAM or BED12 entries as distinct BED intervals when computing coverage. For BAM files, this uses the CIGAR "N" and "D" operations to infer the blocks for computing coverage. For BED12 files, this uses the BlockCount, BlockStarts, and BlockEnds fields (i.e., columns 10,11,12). |
-strand |
Calculate coverage of intervals from a specific strand. With BED files, requires at least 6 columns (strand is column 6). |
-5 |
Calculate coverage of 5' positions (instead of entire interval). |
-3 |
Calculate coverage of 3' positions (instead of entire interval). |
-max |
Combine all positions with a depth >= max into a single bin in the histogram. |
-scale |
Scale the coverage by a constant factor.
Each coverage value is multiplied by this factor before being reported.
Useful for normalizing coverage by, e.g., reads per million (RPM).
Default is 1.0; i.e., unscaled. |
-trackline |
Adds a UCSC/Genome-Browser track line definition in the first line of the output.
See here for more details about track line definition:
|
-trackopts |
Writes additional track line definition parameters in the first line. |
-pc |
Calculates coverage of intervals from left point of a pair reads to the right point.
Works for BAM files only
|
-fs |
Forces to use fragment size instead of read length
Works for BAM files only
|
Default behavior
By default, bedtools genomecov will compute a histogram of coverage for
the genome file provided. The default output format is as follows:
chromosome (or entire genome)
depth of coverage from features in input file
number of bases on chromosome (or genome) with depth equal to column 2.
size of chromosome (or entire genome) in base pairs
fraction of bases on chromosome (or entire genome) with depth equal to column 2.
For example:
$ cat A.bed
chr1  10  20
chr1  20  30
chr2  0   500

$ cat my.genome
chr1  1000
chr2  500

$ bedtools genomecov -i A.bed -g my.genome
chr1   0  980  1000  0.98
chr1   1  20   1000  0.02
chr2   1  500  500   1
genome 0  980  1500  0.653333
genome 1  520  1500  0.346667
-max Controlling the histogram's maximum depth
Using the -max option, bedtools genomecov will "lump" all positions in
the genome having feature coverage greater than or equal to -max into
the -max histogram bin. For example, if one sets -max
equal to 50, the max depth reported in the output will be 50 and all positions
with a depth >= 50 will be represented in bin 50.
-d Reporting "per-base" genome coverage
Using the -d option, bedtools genomecov will compute the depth of
feature coverage for each base on each chromosome in genome file provided.
The "per-base" output format is as follows:
chromosome
chromosome position
depth (number) of features overlapping this chromosome position.
For example:
$ cat A.bed
chr1  10  20
chr1  20  30
chr2  0   500

$ cat my.genome
chr1  1000
chr2  500

$ bedtools genomecov -i A.bed -g my.genome -d | \
      head -15 | \
      tail -n 10
chr1  6  0
chr1  7  0
chr1  8  0
chr1  9  0
chr1  10 0
chr1  11 1
chr1  12 1
chr1  13 1
chr1  14 1
chr1  15 1
-bg Reporting genome coverage in BEDGRAPH format.
Whereas the -d option reports an output line describing the observed
coverage at each and every position in the genome, the -bg option instead
produces genome-wide coverage output in
BEDGRAPH format.
This is a much more concise representation since consecutive positions with the
same coverage are reported as a single output line describing the start and end
coordinate of the interval having the coverage level, followed by the coverage
level itself.
For example, below is a snippet of BEDGRAPH output of the coverage from a 1000 Genome Project BAM file:
$ bedtools genomecov -ibam NA18152.bam -bg | head
chr1  554304  554309  5
chr1  554309  554313  6
chr1  554313  554314  1
chr1  554315  554316  6
chr1  554316  554317  5
chr1  554317  554318  1
chr1  554318  554319  2
chr1  554319  554321  6
chr1  554321  554323  1
chr1  554323  554334  7
Using this format, one can quickly identify regions of the genome with
sufficient coverage (in this case, 10 or more reads) by piping the
output to an awk filter.
$ bedtools genomecov -ibam NA18152.bam -bg | \
    awk '$4 > 9' | \
    head
chr1  554377  554381  11
chr1  554381  554385  12
chr1  554385  554392  16
chr1  554392  554408  17
chr1  554408  554410  19
chr1  554410  554422  20
chr1  554422  554423  19
chr1  554423  554430  22
chr1  554430  554440  24
chr1  554440  554443  25
-bga Reporting genome coverage for all positions in BEDGRAPH format.
The -bg option reports coverage in BEDGRAPH format only for those regions
of the genome that actually have coverage. But what about the uncovered portion
of the genome? By using the -bga option, one receives a complete report
including the regions with zero coverage.
For example, compare the output from -bg:
$ bedtools genomecov -ibam NA18152.bam -bg | head
chr1  554304  554309  5
chr1  554309  554313  6
chr1  554313  554314  1
chr1  554315  554316  6
chr1  554316  554317  5
chr1  554317  554318  1
chr1  554318  554319  2
chr1  554319  554321  6
chr1  554321  554323  1
chr1  554323  554334  7
to the output from -bga:
# Note the first record reports that the first 554304
# base pairs of chr1 had zero coverage
$ bedtools genomecov -ibam NA18152.bam -bga | head
chr1  0       554304  0
chr1  554304  554309  5
chr1  554309  554313  6
chr1  554313  554314  1
chr1  554314  554315  0
chr1  554315  554316  6
chr1  554316  554317  5
chr1  554317  554318  1
chr1  554318  554319  2
chr1  554319  554321  6
-strand Reporting genome coverage for a specific strand.
Whereas the default is to count coverage regardless of strand, the -strand
option allows one to report the coverage observed for a specific strand.
Compare:
$ bedtools genomecov -ibam NA18152.bam -bg | head
chr1  554304  554309  5
chr1  554309  554313  6
chr1  554313  554314  1
chr1  554315  554316  6
chr1  554316  554317  5
chr1  554317  554318  1
chr1  554318  554319  2
chr1  554319  554321  6
chr1  554321  554323  1
chr1  554323  554334  7
to
$ bedtools genomecov -ibam NA18152.bam -bg -strand + | head
chr1  554385  554392  4
chr1  554392  554408  5
chr1  554408  554430  6
chr1  554430  554451  7
chr1  554451  554455  8
chr1  554455  554490  9
chr1  554490  554495  10
chr1  554495  554496  9
chr1  554496  554574  10
chr1  554574  554579  11
-scale Scaling coverage by a constant factor.
The -scale option allows one to scale the coverage observed in an interval
file by a constant factor. Each coverage value is multiplied by this factor
before being reported. This can be useful for normalizing coverage by,
e.g., metrics such as reads per million (RPM).
Compare:
$ bedtools genomecov -ibam NA18152.bam -bg | head
chr1  554304  554309  5
chr1  554309  554313  6
chr1  554313  554314  1
chr1  554315  554316  6
chr1  554316  554317  5
chr1  554317  554318  1
chr1  554318  554319  2
chr1  554319  554321  6
chr1  554321  554323  1
chr1  554323  554334  7
to
$ bedtools genomecov -ibam NA18152.bam -bg -scale 10.0 | head
chr1  554304  554309  50
chr1  554309  554313  60
chr1  554313  554314  10
chr1  554315  554316  60
chr1  554316  554317  50
chr1  554317  554318  10
chr1  554318  554319  20
chr1  554319  554321  60
chr1  554321  554323  10
chr1  554323  554334  70
-split Reporting coverage with spliced alignments or blocked BED features
bedtools genomecov will, by default, screen for overlaps against the
entire span of a spliced/split BAM alignment or blocked BED12 feature. When
dealing with RNA-seq reads, for example, one typically wants to only screen
for overlaps for the portions of the reads that come from exons (and ignore the
interstitial intron sequence). The -split command allows for such
overlaps to be performed.
Coverage by fragment
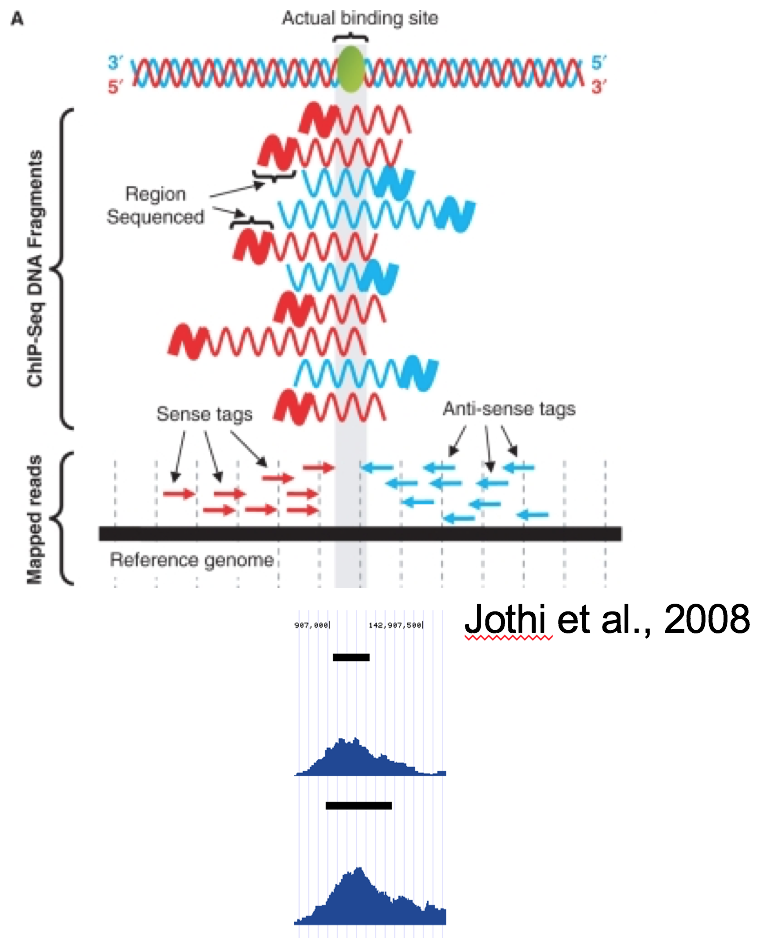
In ChiP-Seq the binding site is usually not at the coordinate where reads map, but in the middle of the fragment. For this reason we often try to estimate average fragment size for single-read experiment and extend the reads in the 5’-3’ direction up to the estimated fragment length. The coverage "by estimated fragments" or by actual pair-end fragments graph is expected to peak at the actual binding site.
-fs Forces to use provided fragment size.
-pc Calculates coverage for paired-end reads, coverage is calculated as the number of fragments covering each base pair