Compute basic statistics, rarefy and summarize OTU/SV tables using micca
Note
This tutorial requires Paired-end sequencing - 97% OTU to be done.
The command tablestats reports a sample summary, an OTU summary and the rarefaction curves for the input OTU/SV table:
micca tablestats -i denovo_greedy_otus/otutable.txt -o tablestats
Inspecting the file tablestats/tablestats_samplesumm.txt you can see that
the less abundant sample contains 512 reads:
Sample          Depth   NOTU    NSingle
B1114D1-PL1-E4  512     145     68
B1014D2-PL1-C4  1356    152     57
B0214D3-PL1-F1  1665    192     74
...             ...     ...     ...
Note
Rarefaction curves can be inspected through
tablestats/tablestats_rarecurve.txt and
tablestats/tablestats_rarecurve_plot.png.
To compare different samples, the OTU/SV table must be subsampled (rarefied) using the command
tablerare. In this case we are interested in rarefy the table
with the depth of the less abundant sample (B1114D1-PL1-E4):
micca tablerare -i denovo_greedy_otus/otutable.txt -o denovo_greedy_otus/otutable_rare.txt -d 500
Now we can summarize communities by their taxonomic composition. The
tabletotax creates in the output directory a table for each
taxonomic level (taxtable1.txt, …, taxtableN.txt). OTU counts are
summed together if they have the same taxonomy at the considered level.
micca tabletotax -i denovo_greedy_otus/otutable_rare.txt -t denovo_greedy_otus/taxa.txt -o taxtables
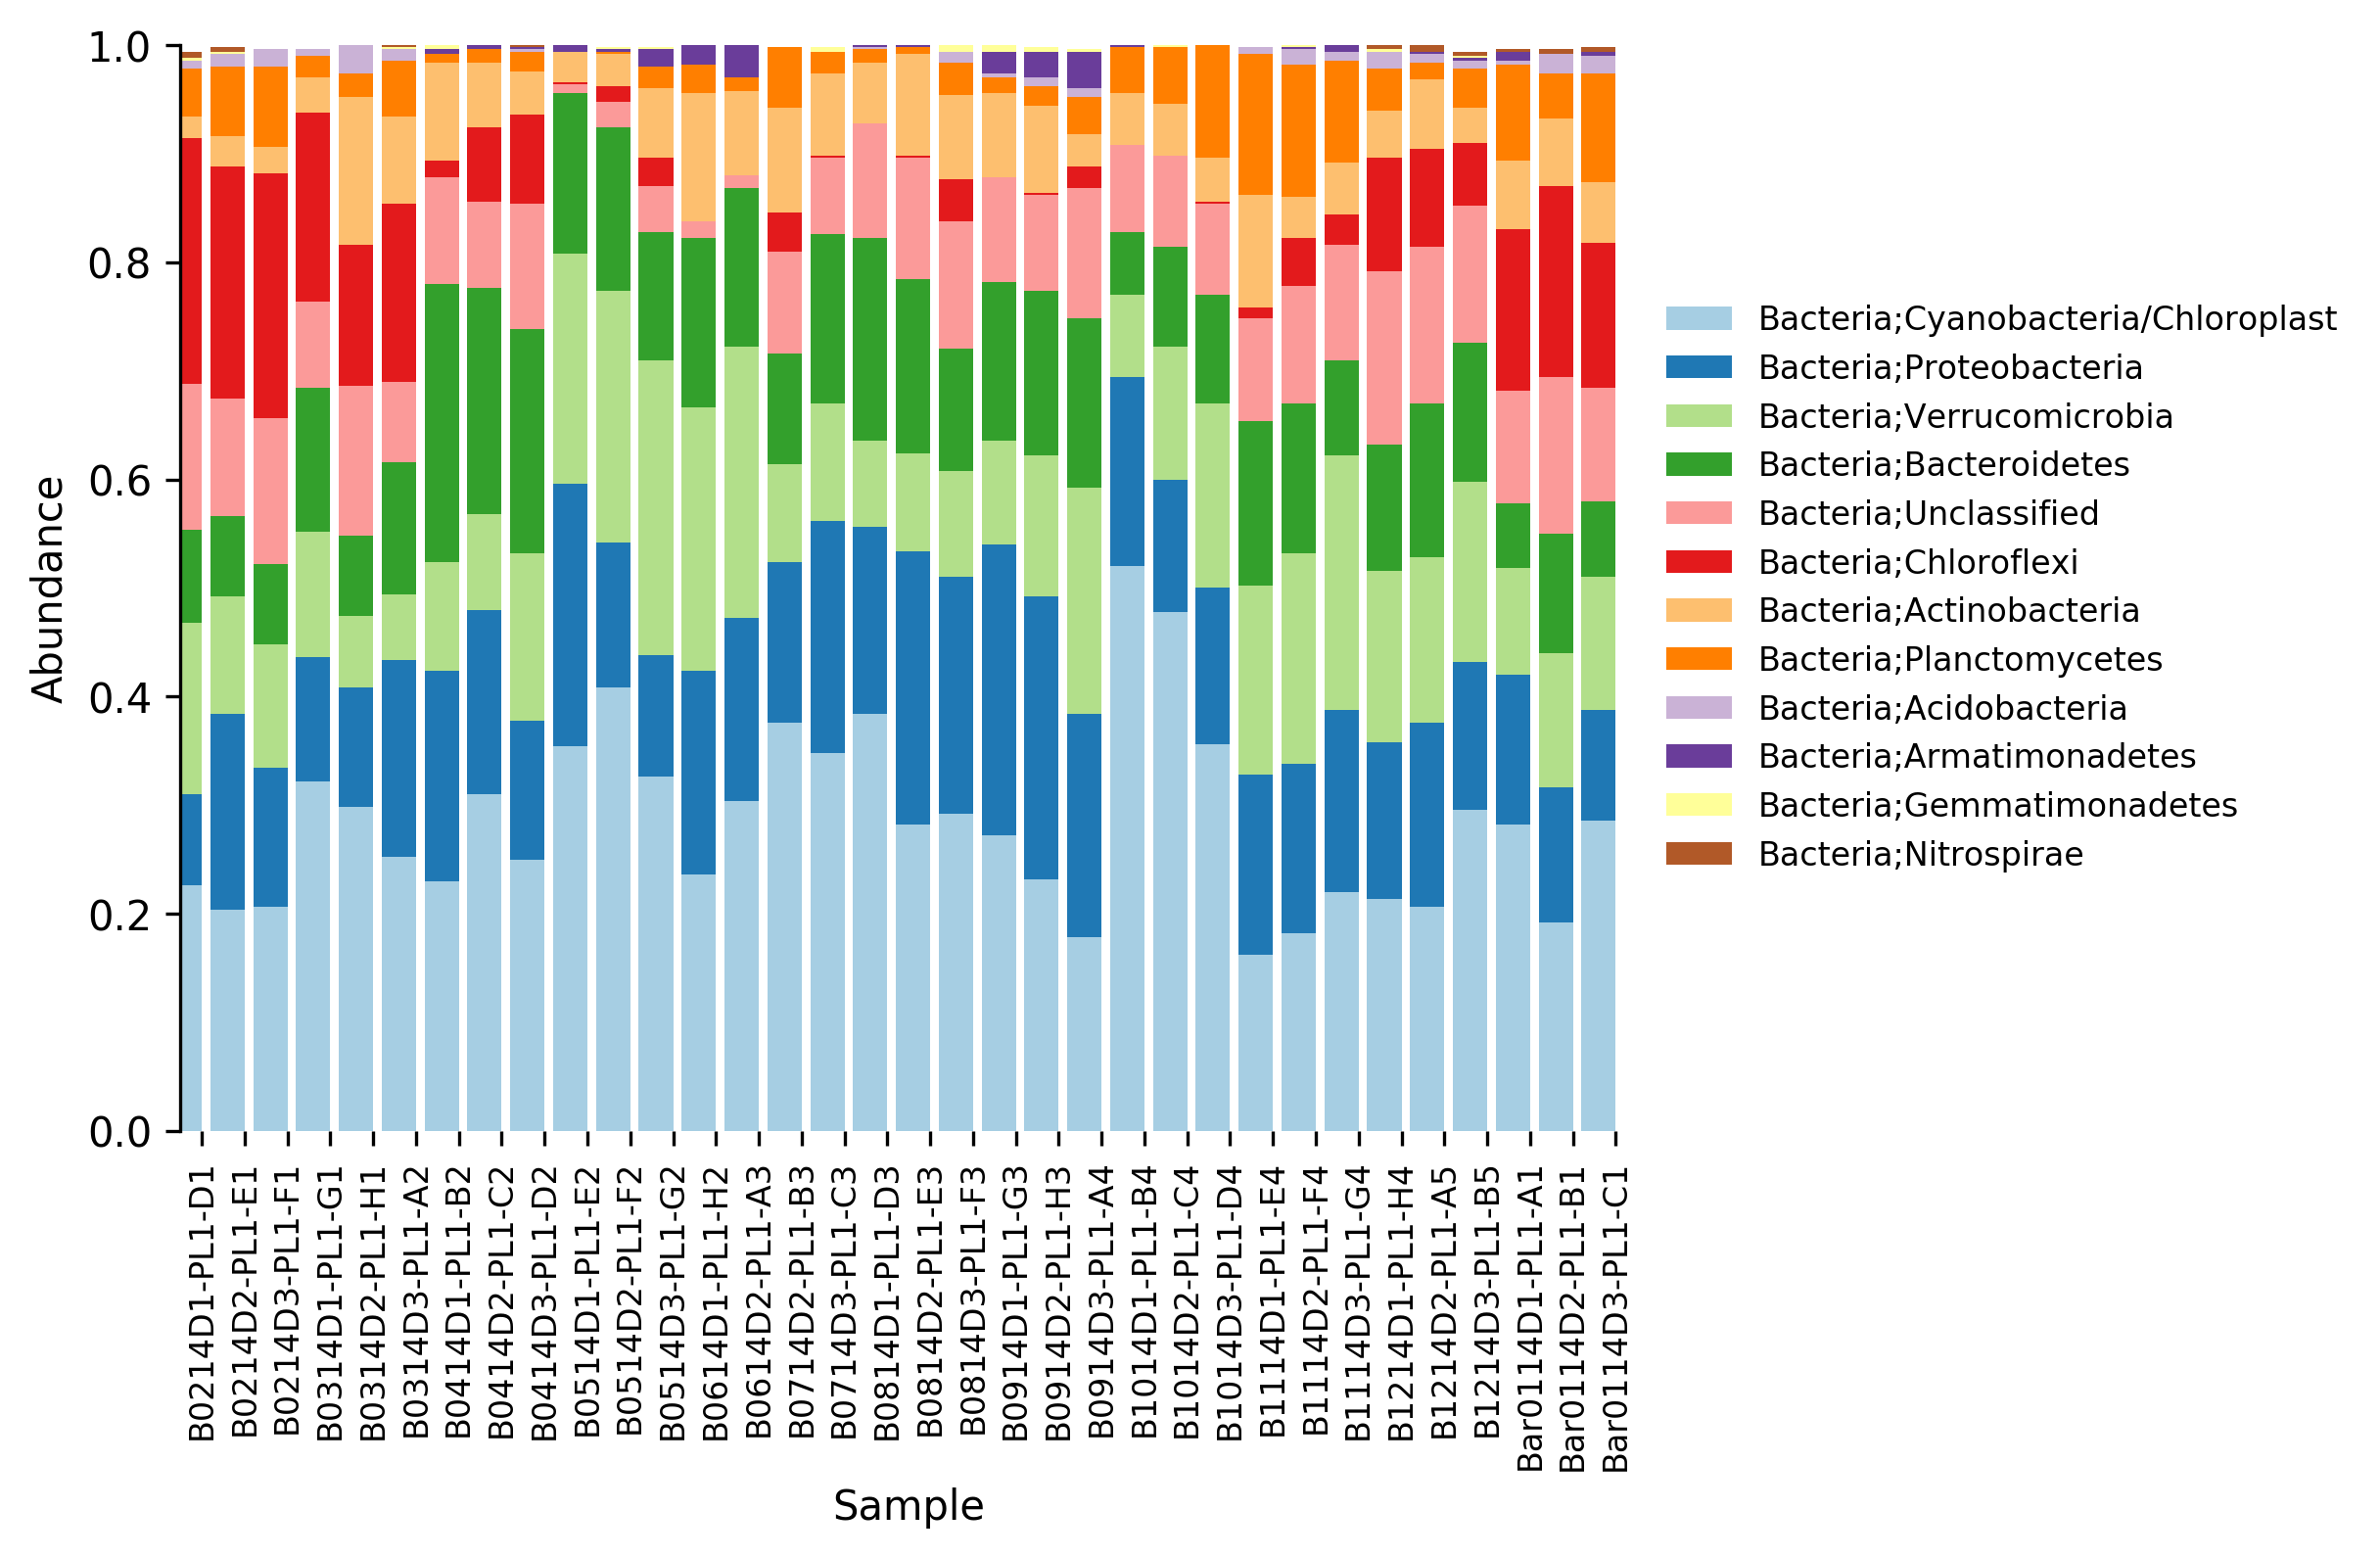
Finally, we can generate a relative abundance bar plot from generated taxa tables, using the command tablebar. In this case only the bar plot relative to the taxonomy level 2 (phylum) will be generated:
micca tablebar -i taxtables/taxtable2.txt -o taxtables/taxtable2.png